Use Cases Guide The Way To Data Maturity

Timm Grosser, Nina Lorenz, BARC
From our last two blog posts, you learned why silos, organizational and technical, slow down your business success and what you can do about them. In the third and final part of the blog series, we get down to the nitty-gritty: how do you successfully implement a data management use case? We explain lessons-learned with two practical cases and summarize what we've discovered.
Data Need Expertise
The need for high data quality (in terms of availability, access, usability, traceability and interoperability) is undisputed. But this is often easier said than done with the existing IT infrastructure in companies. Overcoming the obstacles requires a rethinking of how data is stored and managed. Especially when data from multiple data silos is to be used, combined and leveraged for automated reasoning, efficient knowledge-driven data management is required.
Uncoordinated actions like centralized data collection do not solve our data problems at all. At worst, we get drowned in our own data overload and complexity. On the other hand, data collection is essential to be able to implement certain use cases and thus generate business value from data. The trick is to be able to recognize which data is valuable for the company - and to decide strategically where data should be stored.
The Difference Lies With The Objective
It is therefore helpful to start with a clearly defined use case. Use cases allow to match and visualize effort and resources tied up with measurable benefits. It is therefore not surprising that projects born out of actionism that do not follow an operational focus often fail.
Prominent examples of this failure are data lake projects that are initialized from within the IT department. The intention is usually to set up a future-proof solution without being clear about which and how data is actually needed or could be needed for the respective use cases. Data access in particular is a major challenge here.
The ultimate challenge is to be able to find and reuse data once it has been collected for different applications in the company. The ultimate goal should be to enable holistic access to data. The use cases themselves prioritize the measures to achieve this.
The Key to Successful Data Management is Stakeholder Knowledge
From our consulting activities at BARC, we can report that data-driven use cases are by no means the common approach in companies. They don't necessarily struggle with technical obstacles; rather, data-driven use cases must be developed step by step. This requires knowledge and skills, most of which have to be built up first. The first important step is therefore to gain clarity about potential use cases and their data requirements.
Use cases are the starting point for the correct and efficient management of goals, resources and activities related to data. This requires an understanding of business requirements. They should be taken as a benchmark to set priorities correctly.
Figure 1: Use cases define the requirements for Data & Analytics
There will be more use case for cross-system data requirements.
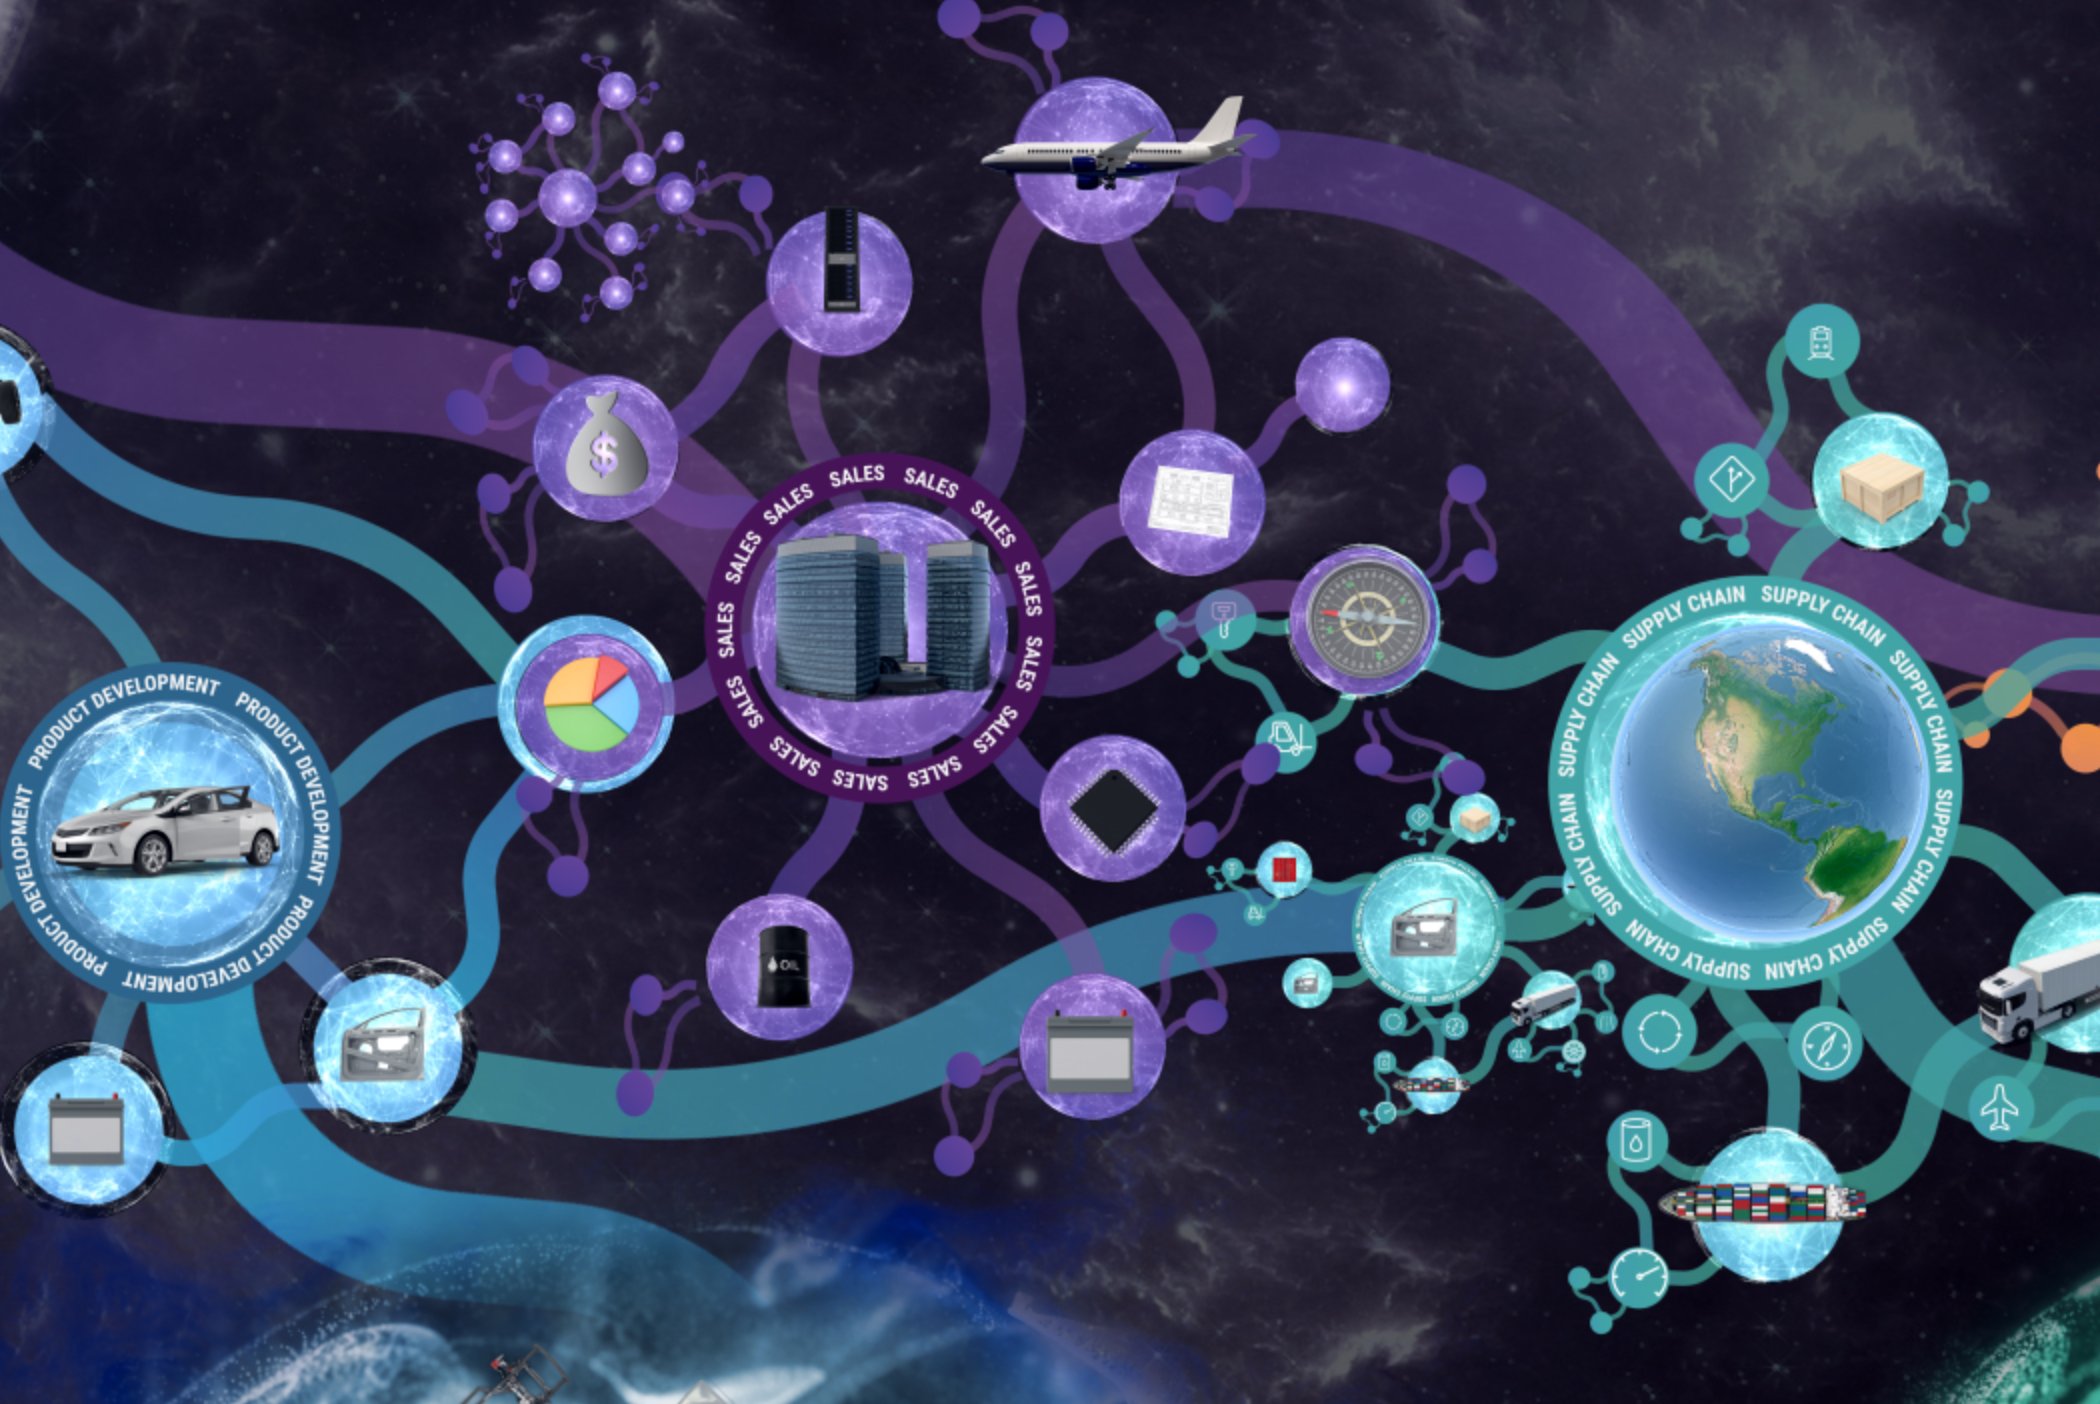
In the pursuit of optimization and innovation, it is not always a matter of identifying the most unusual use cases but rather about being able to use one's opportunities with data consciously and extensively. Use cases exist in large numbers. And increasingly, use cases require enterprise-wide access to data, such as Customer360, hyperautomation, GDPR, predictive maintenance, you name it.
Using the following two use cases, I would like to point out important lessons learned when it comes to the cross-functional use of data, where knowledge about data is essential.
Use Case 1: Data Harmonization at a Pharma Company
An interesting use case occurs in the development of drugs. The process of creating clinical trials should become more efficient and less expensive. The main lever is to avoid duplication of work/research by reusing knowledge.
For years, for example, a pharmaceutical company has been collecting large amounts of data from long-term studies, approval procedures and experiments. The challenge is to make this information usable. Typically, information on active ingredients is widely distributed across several hundred systems, some with different names and in different contexts.
In order to make the information easier to find, the naming of active ingredients was to be harmonized and essential information on active ingredients was to be made findable. The goal was to create a "yellow pages" for active ingredients.
A Knowledge Graph was chosen as the technology for implementation. Representing records as graphs made it more practical to bring instance data and metadata together in a single harmonized model. Graph technology has since implicitly supported disambiguation of data objects and provided a good basis for exploratory searching in the data along relations. This, in turn, reduces the effort required to search and reuse available data in research for new medical applications of existing drugs.
Lessons learned
First of all, the objective in such a data project is broader than often represented in textbooks because it includes things like process efficiency, transparency, encouraging innovation and saving duplication of work (e.g. interaction of agents that have already been established do not need to be tested again).
There are 100 odd systems involved in the process. Linking them in terms of content seems an enormous undertaking. In this case, the decision was made not to integrate, but to build up the knowledge via a knowledge graph solution on top of the systems and to reference details (such as results on studies). The first step was to create a global terminology. First, master data, in this case ingredients, were identified. Part of the identification process was to link the different names given to ingredients depending on the process step. This was then used to successively add further modules to the knowledge database.
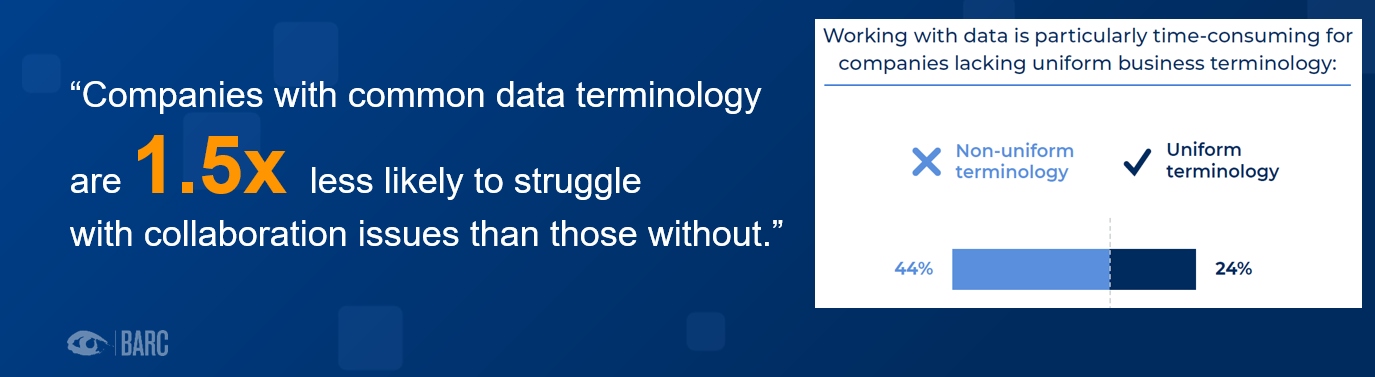
Figure 2: Companies that use a common data terminology have 1.5 times fewer problems with collaboration than companies without this terminology. Source: BARC Survey Data Black Holes - Are Data Silos Undermining Digital Transformation? n: >300
One pitfall was creating the willingness to maintain the data. Automatic mechanisms for integrating data meant that a lot of information about data could already be retrieved from the systems, which relieved the specialists from administrative work as far as possible. In addition, new requirements for the usability of data surfaced. The data producers had to build up competencies and knowledge in order to make future, but also existing data and documentation usable for others. The motivation for this was accomplished through transparency on the further use and value of the data as well as the setting of monetary incentives.
Parallel to the project, it was essential to establish clear overarching structures with management-level responsibilities for the data. It was essential to maintain the local nomenclature of terms for user acceptance. Technically, the local identifiers were mapped to a master object (i.e., a globally valid, standardized identifier) for identification purposes. Overall, this resulted in a noticeable acceleration of the process and provided a database that allows reuse for further innovative use cases.
Use Case 2: Customer360 in Retail
The most valuable asset for commerce is the consumer. Customer360 helps to better understand and do business with customers and protect their privacy.Therefore, for a large retail chain with offline stores and online commerce, investments were to be made in customer data and a holistic view of customer data was to be developed first for the online offering and, in perspective, for the offline stores. The goal was to increase customer loyalty and to be able to better place product/service offers. The starting point was a non-integrated application landscape with distributed customer data, including in a data warehouse and a data lake for customer transaction data.
In this case, graph technology was also used to provide a holistic view of the customer, their history and interactions with the company. This linked all customer data together - including accounts, their types, purchase histories, interaction records, preferences and legal - to provide a complete picture of the relationship with the company. This provided the database to calculate and optimize behavioral models while incorporating a larger data set consisting of data and the associated metadata.
According to the project team, this enabled more extensive patterns to be identified and used through machine learning algorithms. As a result, the model now delivers automated recommendations that are embedded in the online store via a recommendation engine or activates extra services in the CRM system as soon as the customer is identified as being at risk of churn.
Lessons learned
In this use case, a highly motivated project team came together to push things forward. The objectives were comprehensive and challeging:
- prevent churn,
- increase loyalty,
- increase customer retention through better customer understanding,
- enhance user experience through better services such as real-time discounting and recommendations,
- all while complying with GDPR.
The main challenge was to get the right management support. As is often the case, lip service has to be transformed into corresponding investments.
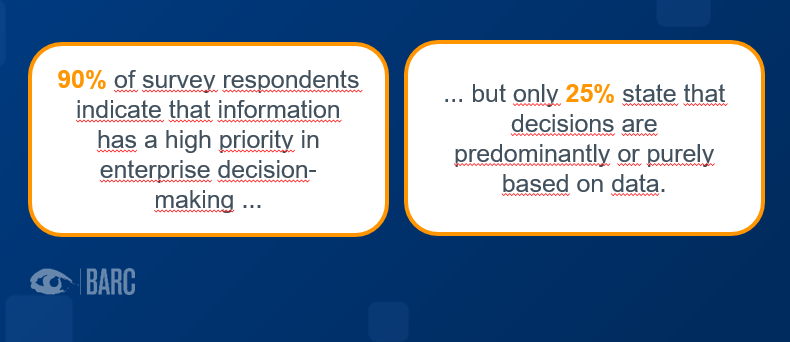
Figure 3: Words must be followed by deeds. In companies, there is a gap between wish and reality. BARC Surveys "Leverage Your Data" 2020, Agreement to statements concerning data handling (n=412), relevance of business-related challenges (416)
The team documented the value of existing, missing and undiscoverable data for selected use cases. An attempt was also made to estimate the damage from doing nothing, and this was contrasted with the benefits of the new approach. Clearly documented requirements and a meaningful benefit/risk calculation convinced the management. The budget was approved for a "Recommendation Engine" pilot. This allowed the team to start integrating the first systems into the Knowledge Graph. After the first prototype "Recommendation Engine", the database should serve further applications.
A first challenge arose in the discussion of data ownership of the customer data. The search for suitable data owners almost brought the project to a standstill. Only after clarifying the organizational structures around data ownership and the data processes could the data requirements be refined, differences of opinion be resolved, and further applications be implemented.
Conclusion of the three-part blog series
Overall, we see two categories among our customers. Those that need to build basic competencies for data and analytics first. And those who are already entering the uncharted territory of cross-functional use cases. The latter use cases are tending to increase, and with them the need to be able to access data across systems. So far, stand-alone cases for automated decision support and - the supreme discipline - cross-system use cases are less common. In both cases, the underlying data and metadata must be available unambiguously and in suitable quality across system boundaries. In the future, however, these cases will increase. In particular, use cases involving artificial intelligence will become interesting.
If we look at the above mentioned and other use case examples, we see the following pattern:
- Technology is not everything. Organizational and cultural tasks weigh more heavily.
- Bringing awareness to data producers and getting management on-board are sensitive acts.
- Graph technologies help to make complex knowledge in data accessible and explorable, especially by documenting and exploring relations.
- Inherent data quality creates trust in data. However, this also requires clear responsibilities.
- Acceptance is essential: Start small with lighthouse projects. Demonstrate efficiency and benefits and make them transparent.
Data is becoming more important and with it the need to be able to understand and use data is growing. It is a good time to look at technologies such as Knowledge Graphs. From a BI & Analytics perspective, different skills, approaches and terminologies are challenging, which raise the bar for Knowledge Graphs (e.g. Provenance vs. Data Lineage). In principle, you will always get the same quick answer from a user of relative databases: We can model that too. But one shouldn't put too much weight on that statement.
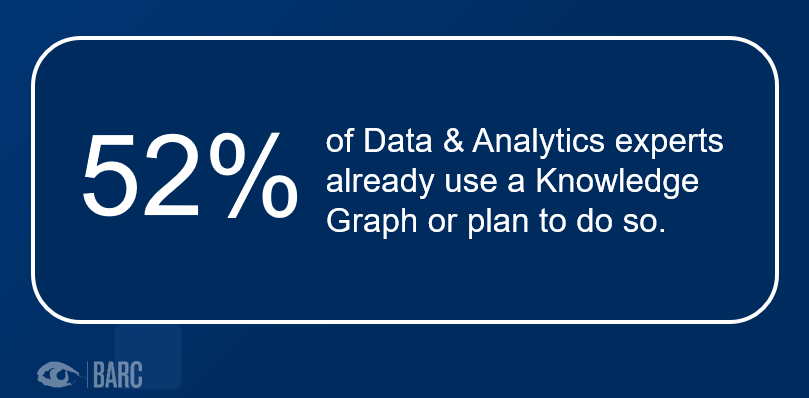
Figure 4: Knowledge Graph solutions are becoming increasingly important in companies. BARC Surveys "Leverage Your Data" 2020, Agreement to statements concerning data handling (n=412), relevance of business-related challenges (416)
It is time - due to growing complexity in data and their relations - to take a closer look at knowledge graphs. The meaningfulness is also shown by the fact that long-established platforms for data & analytics on the market are beginning to integrate "semantics" in the form of graph databases into their platforms. Only in this way can they a) increase flexibility for business users through data access, and b) efficiently manage and (logically) integrate data across systems.